Forecasting and staffing
Erlangly works out how many agents you need in two steps. First a forecast: how many contacts each line of business will get in each interval, and how long they'll take to handle, from your history. Then staffing: how many agents those contacts need to meet your service target, plus the time agents are paid for but away from contacts. Scheduling then places shifts to cover that.
Before you start
- Volume history for each line of business: contacts and handle time per interval. A connected ACD reads it for you, up to 13 weeks back (as far as your ACD keeps) when you match its queues, then every 15 minutes. Otherwise, import it from a spreadsheet. Six weeks or more is best.
- A service target and shrinkage for each line of business. Erlangly uses sensible defaults until you set them: see Service targets and shrinkage below.
Make a forecast
- Open Forecast and choose New forecast.
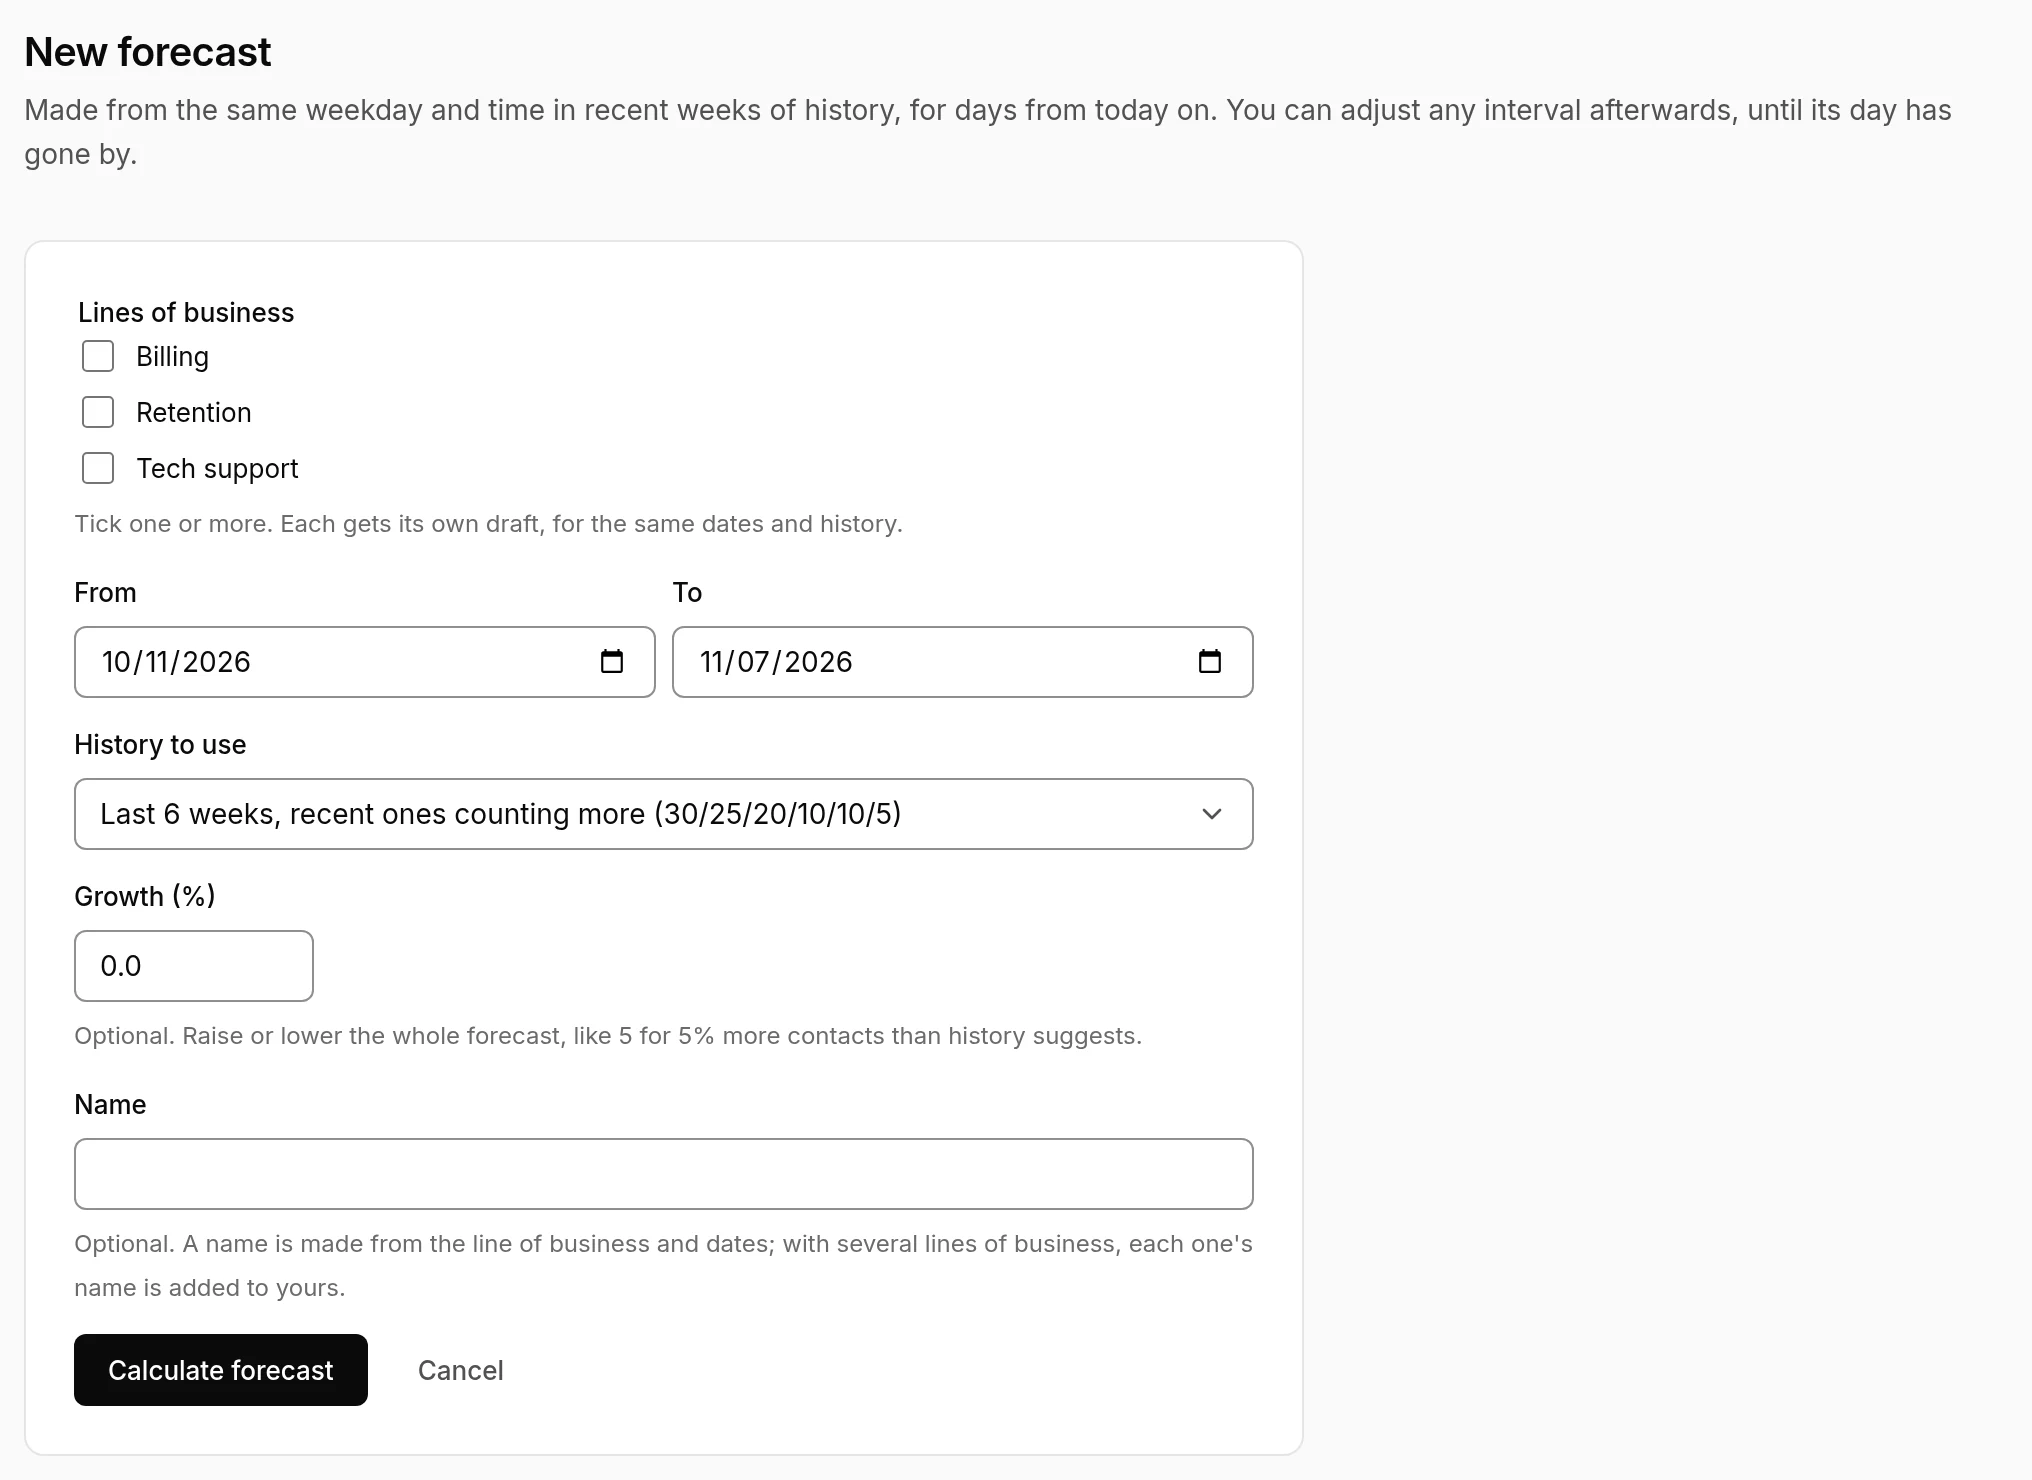
- Tick the lines of business. Each gets its own draft, for the same dates and history.
- Choose the dates. A forecast starts today or later, and covers up to a year. The dates offered are the next planning period.
- Choose the history to use. The default is the last 6 weeks, recent ones counting more.
- Add growth if you expect more or fewer contacts than history suggests: 5 for 5% more, -10 for 10% fewer.
- Choose Calculate forecast.
How the numbers are worked out
Each interval is forecast from the same weekday and time in recent weeks, with recent weeks counting more. With the default weighting of 30, 25, 20, 10, 10 and 5, if the last six Mondays at 09:00 had 110, 100, 90, 80, 70 and 60 contacts (newest first), next Monday at 09:00 is forecast at 94:
(30 × 110 + 25 × 100 + 20 × 90 + 10 × 80 + 10 × 70 + 5 × 60) ÷ 100 = 94
- Handle time is averaged the same way, weighted by contacts, so busy intervals count for more than quiet ones.
- Public holidays in your history are left out, from the labour law your organisation follows. A quiet Labour Day doesn't drag every Monday down. Days with no contacts at all, like an outage or missing data, are left out too. The next older week is used instead.
- Growth is applied last: 94 with 10% growth is 103.4.
- With fewer weeks of history than you asked for, the forecast uses what there is and says so at the top: Only 3 weeks of history for Saturdays. With none, it's empty, and says so.
Check it
A forecast opens on its whole date range. Pick the same day for From and To to see that day's intervals.
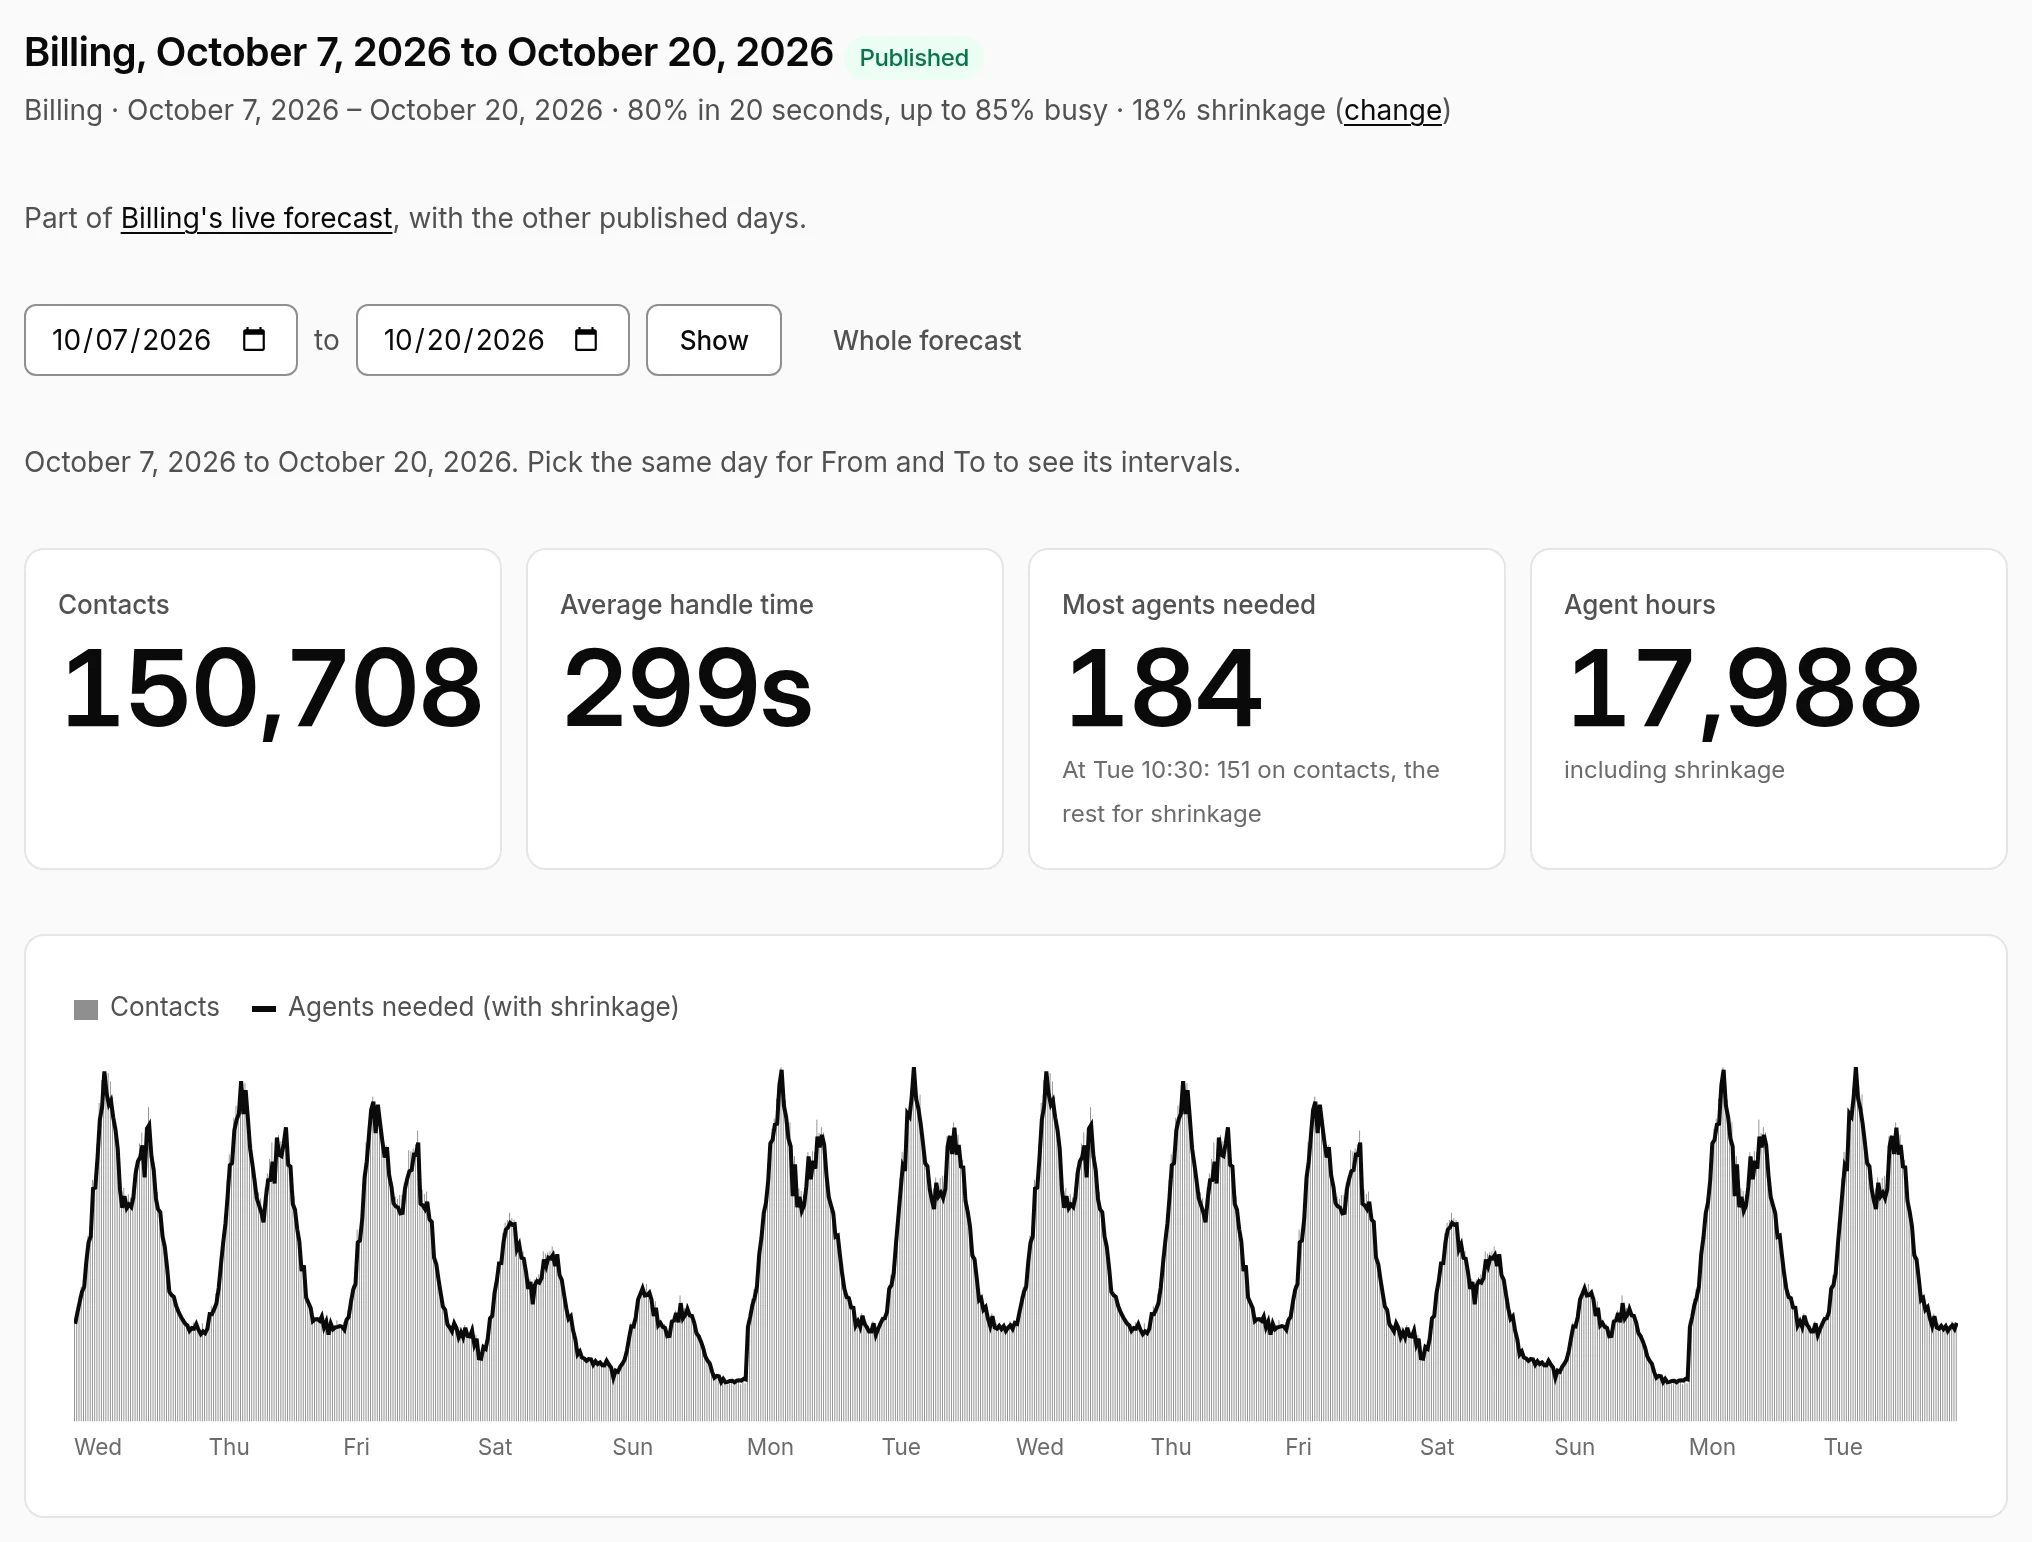
- Contacts and Average handle time for the days shown.
- Most agents needed, and when. When some are for shrinkage, it says how many are on contacts.
- Agent hours, shrinkage included: the hours a schedule needs to cover.
- The chart: contacts and agents needed, interval by interval.
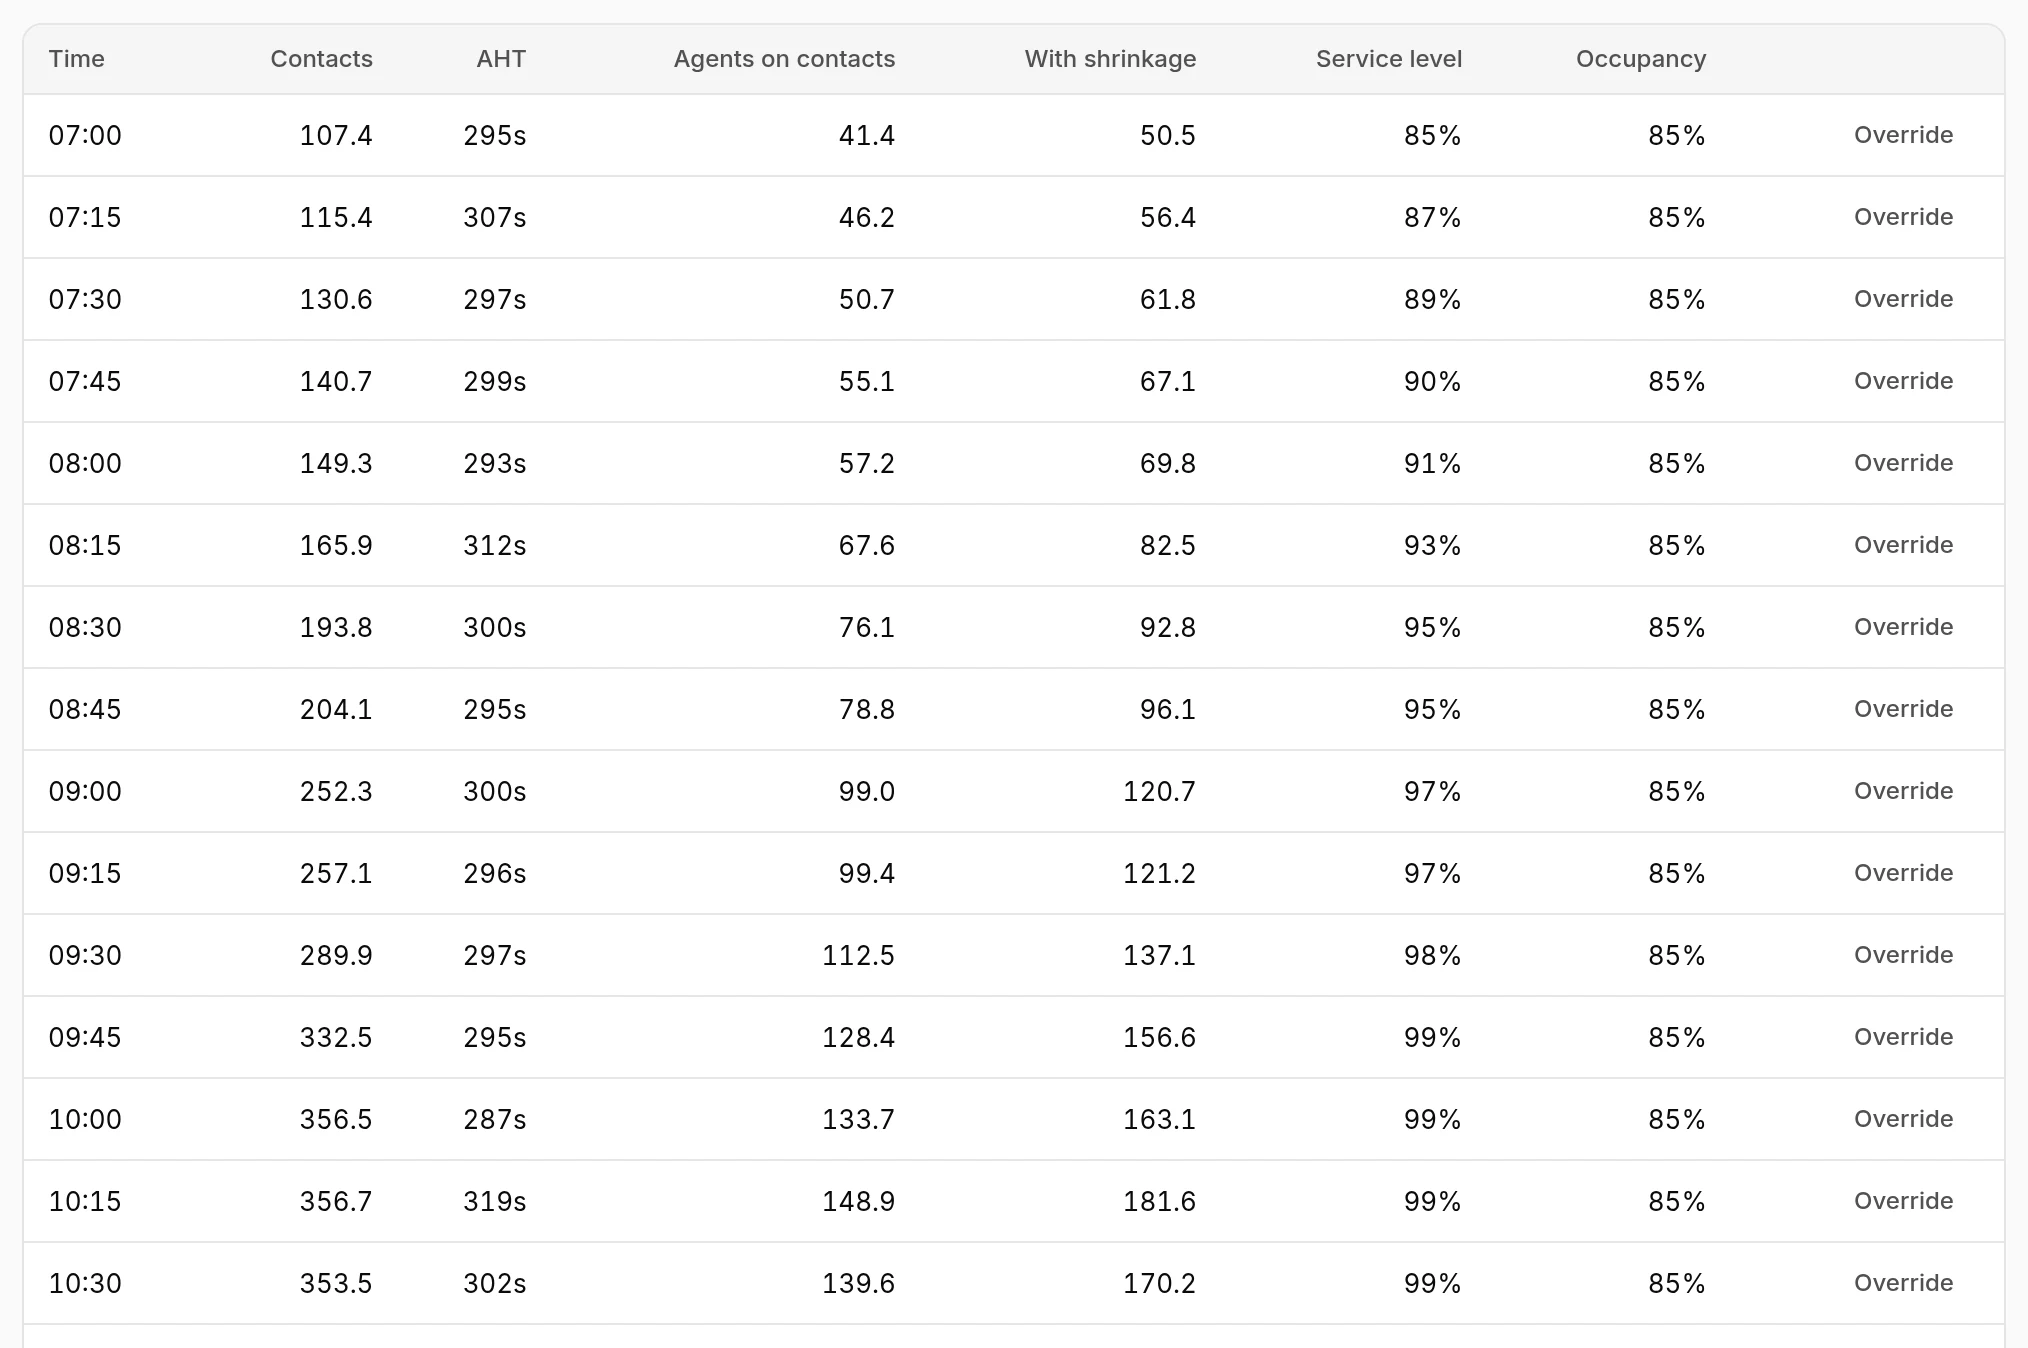
A day's intervals show the staffing behind the figures:
How it did
Once actual volumes come in for a forecast's days, it says how it did. For example: it forecast 12,410 contacts and 12,032 came (3.1% over). Interval by interval it was off by 8.4% of contacts. The second figure adds up each interval's miss, so quiet intervals that were off by one or two don't swamp it.
Adjust it
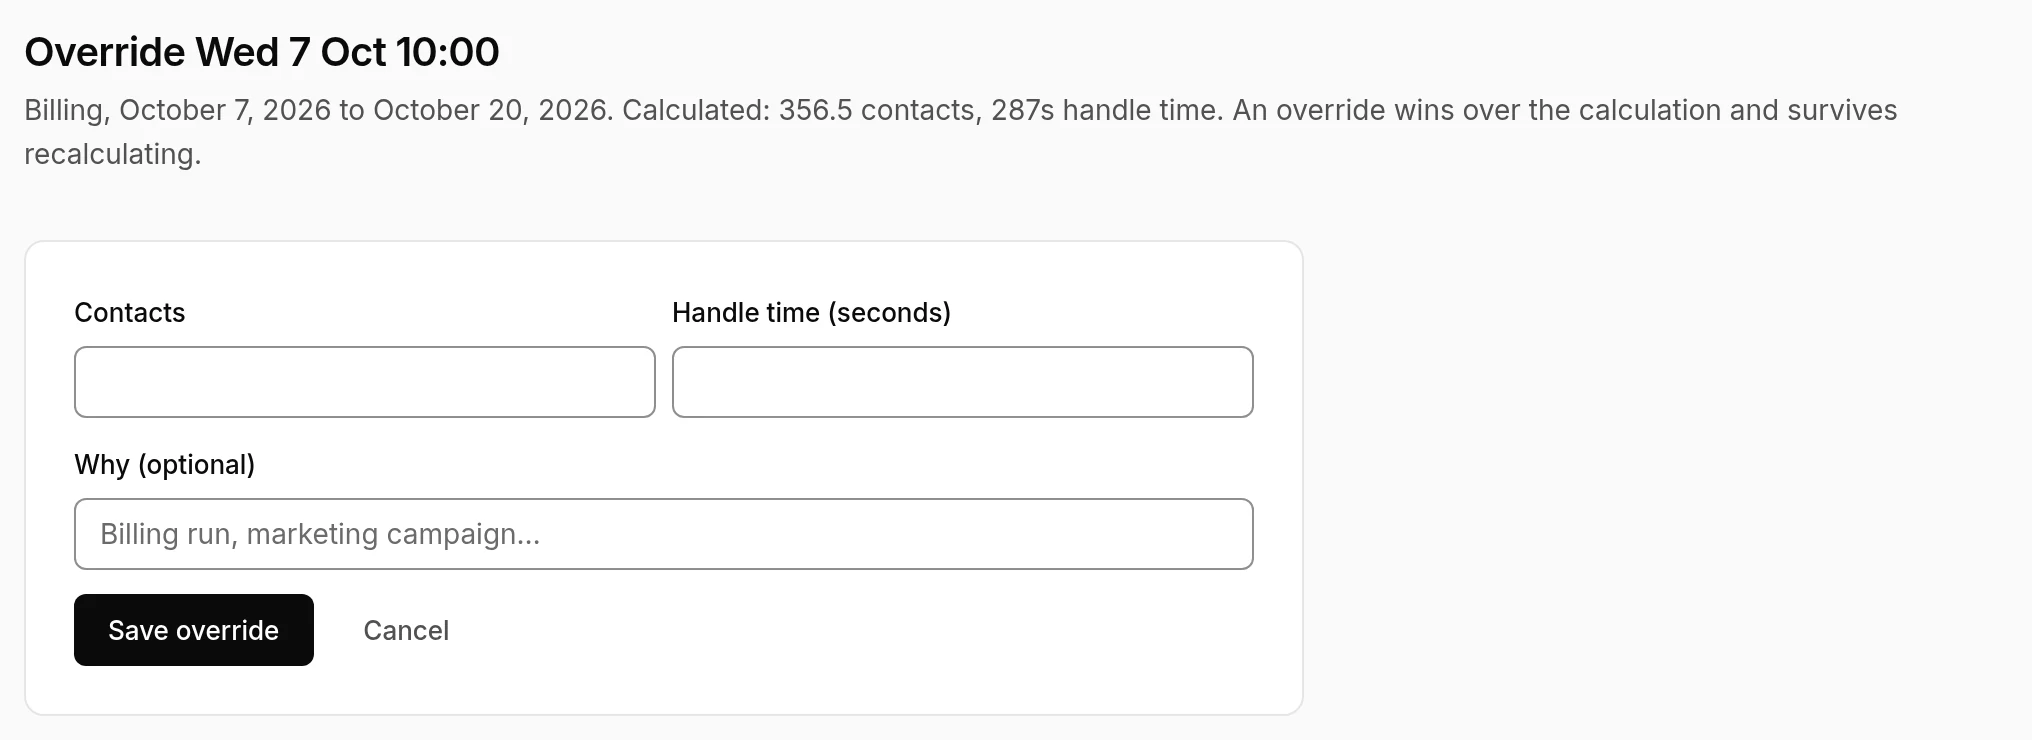
- Override an interval when you know something history doesn't: a billing run, a campaign, a system change. Set its contacts, its handle time or both, and say why. An override wins over the calculation, and it's kept when you recalculate.
- Recalculate to use the latest history, keeping your overrides.
- Change the dates, history or growth, then Save and recalculate.
Days that have gone by don't change: a forecast is measured against what you planned.
Publish it
Publish makes a forecast its line of business's live forecast: the one staffing and scheduling use. Forecast lists each line of business with its live forecast and its drafts.
- A published forecast already covering some of the same days gives way for those days. They're archived, not lost: the history of what was published, and when, is kept.
- Changing a published forecast flags the schedules for the days it changed, so they're generated again. That covers an override, a recalculation or new dates.
- Drafts can be deleted; published forecasts can't.
How many agents you need
For each interval, Erlangly works out the agents needed from the forecast's contacts and handle time, the line of business's service target, and its shrinkage. How depends on the channel.
Calls
Calls (and blended lines) use Erlang C, the standard model for calls arriving at random and waiting in a queue. Erlangly finds the fewest agents that answer your target share of calls within your target time, like 80% in 20 seconds, while keeping agents no busier than your maximum occupancy.
Whichever is stricter sets the number. In the day above, service level runs at 90–99% while occupancy sits at its 85% limit: at Billing's volumes, the occupancy limit needs more agents than 80% in 20 seconds does.
Chats
An agent handles several chats at once. Erlangly divides the work by what one agent can carry (the chats at a time, less some for switching between them). It adds a margin for chats arriving in bursts, then caps occupancy. The service level shown for chats is your target, not a prediction.
Email and tickets
Email and tickets don't queue for a reply in seconds, so their staffing is the work in the interval: contacts × handle time ÷ the interval's length.
Shrinkage
Shrinkage is time agents are paid for but not on contacts: absence, training, coaching and meetings, and anything else you track. Erlangly adds the categories up and grosses up the agents on contacts once:
agents with shrinkage = agents on contacts ÷ (1 − shrinkage)
At 09:00 above, 99.0 agents on contacts become 120.7 with Billing's 18% shrinkage. Breaks aren't shrinkage: the schedule places them, and counting them here too would count them twice.
Service targets and shrinkage
Set them for each line of business under Settings → Lines of business, on the line's page. Each applies from the date you choose, so figures for days before it don't change.
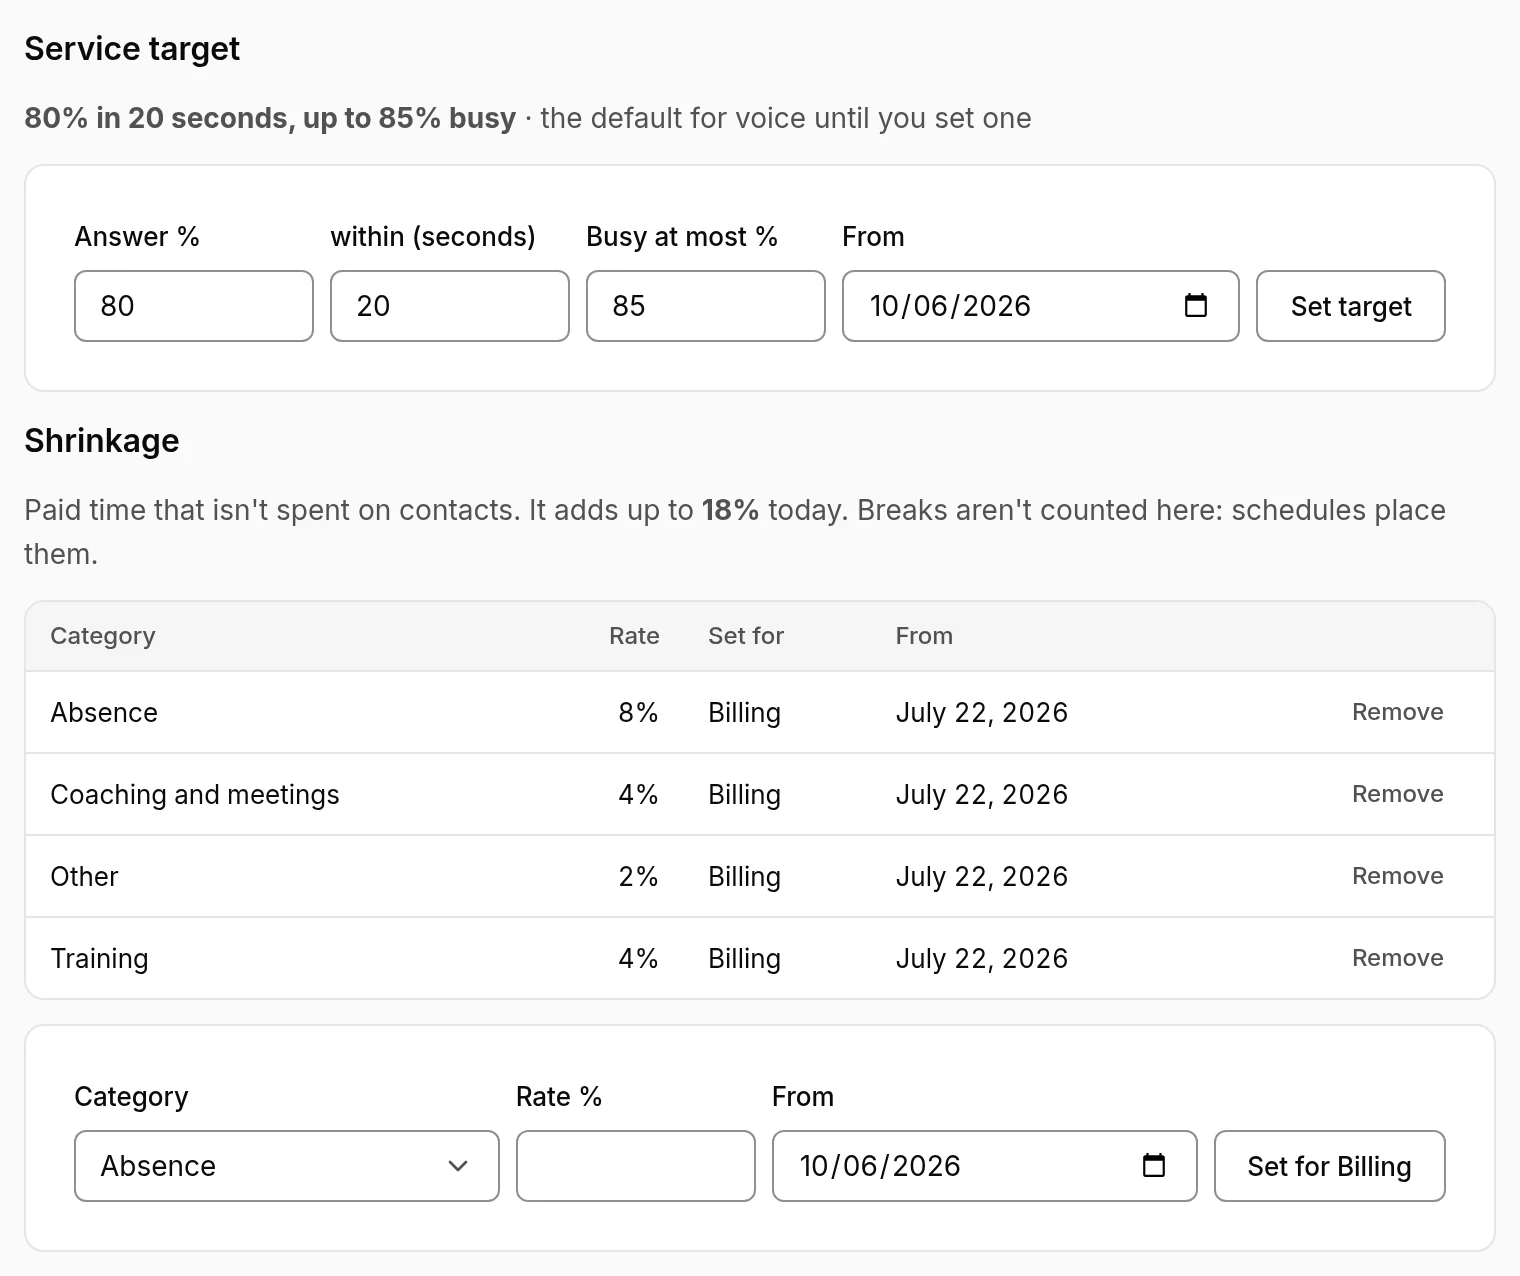
Until you set one, a line of business uses the default for its channel:
- Calls: 80% answered in 20 seconds, agents up to 85% busy.
- Chats: 80% in 60 seconds, 3 chats at a time at 85% efficiency, up to 85% busy.
- Email and tickets: 90% within a day, up to 85% busy.
Next
With a published forecast for each line of business and their shift patterns, you're ready for a schedule: see Scheduling. The Schedule page's Start here checklist shows what's left.